Clean Air Council creates interactive air quality map: See what you breathe
As part of its three-year air monitoring project, the Clean Air Council has created an interactive map of the Chester industrial corridor and parts of southeastern Philadelphia that lets you see air quality levels in real time, as reported on the monitors sited around the area.
The map — What’s in the Air We Breathe Storymap – also tells you how many violations of air, water and waste pollution each polluting industrial facility has incurred in the last five years and how much each has been fined for those violations.
The Clean Air Council recently made its last report to the community, finding that overall, during the last two years, air quality for particulate matter has remained in the good to moderate range throughout the monitored area, except when Delaware County and the rest of Pennsylvania are subjected to smoke from wildfires. The wildfires most often originate from Canada.
You can use the site to learn about how the Environmental Protection Agency measures air quality, learn about the polluting industries within the Chester-Marcus Hook industrial corridor, and see the data.
You can view the slides from the final report meeting on Nov. 11, 2026, HERE and a video of the meeting HERE.
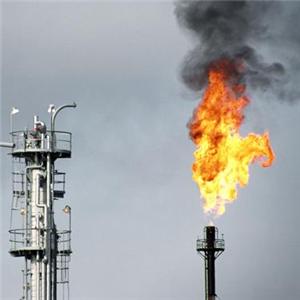
PHOTO/Flare at Monroe Energy, courtesy of Chester City Blog